Previous article: 2011 England Riots: Statistics of Ethnicity
Very short summary:
1. Black people are heavily overrepresented in all riots but one (Salford, 1.7% of arrests)
2. Over 50% arrested are black in all London riots (up to 82% black, 10% white in Lambeth)
3. All but two London areas (both central) with above average black population rioted
4. Poor and uneducated non-black areas did not riot or had small riots
5. Older black people are more likely to riot than whites of any age, incl. youths
6. Whites aged 10-17 are not overrepresented, blacks aged 10-17 are - heavily
7. Black Londoners are 2.87 times as unemployed as whites, but 9.65 times more likely to riot
Introduction
(For the purposes of the research, I assume that people arrested for riots are representative of rioters)
The Ministry of Justice has released data on the rioters, including a detailed account of their ethnic composition. The data confirm the previous observations on the role of ethnicity in the riots. There is also information on Liverpool and Nottingham, though not on Bristol. I will visualise the new data on London, Greater Manchester, West Midlands, Nottingham, and Merseyside to show how it corresponds to the previous research.
The media still appear apathetic to the role of ethnicity - for instance, the BBC article on MoJ report is titled England rioters 'poorer, younger, less educated', as if those factors had a large predictive power. Moreover, it repeats the Ministry of Justice claim that "In some areas - such as Salford - this partially matched the ethnicity of the general population, in others - such as Nottingham - it was not representative of the general population". In fact, Salford is the only instance of the rioters matching the ethnic makeup, and it accounts for just 1.7% of all defendants. In all other cases black Britons were heavily overrepresented.
Majority of rioters are black: confirmed
46% of riot suspects across England and Wales are black, but the figure raises to 55% in the London riots, which account for 70% of the arrests:
Fig. 1. Source: MoJ report (Table 1.9)
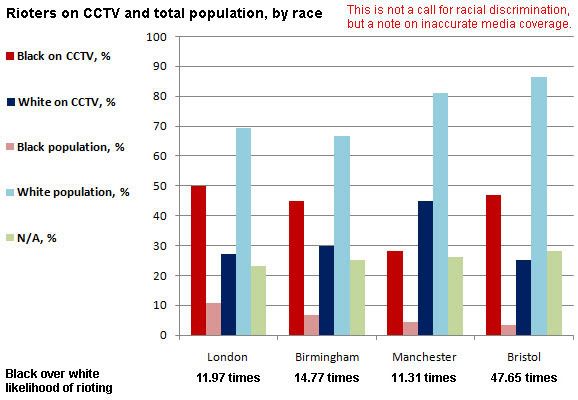
Since there were no official ethnic data released until late October, I had to use CCTV images to determine the approximate ethnic makeup of rioters. The new data prove the validity of this approach. Note that 16.7% of the defendants in London refused to state their ethnicity, which exceeds the number of unidentifiable people on CCTV, meaning its relative accuracy. The overall data for the largest riots are as follows (see the previous estimation for comparison):
Fig. 2. Sources: MoJ report (Table 1.12), ONS ethnicity estimates
No data are available on Bristol, but Nottingham demonstrates similarly great disproportions. Birmingham is included into West Midlands, Manchester into Greater Manchester. 33% rioters in Birmingham were white and 46% were black (17.3 times more likely to riot than whites). 67% rioters in Manchester were white and 25% were black (4.2 times more likely to riot than whites).
Fig. 3. Source: MoJ report (Table 1.13)
Overall, blacks are extremely overrepresented (13.4), Other (East Asian, Afghan et al.) are in the middle (2.1), whites and Asians are equally underrepresented (both 1.0).
Black adults rioted more than white youths
The rioters are most frequently described as youths, but black people aged 21 to 39 are by far more likely to riot than any white age group, including the most risk-prone group aged 18 to 20. The overrepresentation of black people aged 10 to 17 and 18 to 20 is possibly the most dramatic feature of the England riots. The former is somewhat understressed because the group is too broad, including very young people (aged under 14).
Fig. 4. Sources: MoJ report (Table 1.16)
The pertinence of ethnicity seems to overshadow any other aspect. Below is a comparison of ethnicity-based factors to the key factors chosen by the BBC. BBC focus on juveniles (aged 10 to 17) is interesting, but people aged 18 to 39 were more important and numerous. Moreover, the BBC claim about juveniles being unusually riot-prone does not hold water for white juveniles. 10.3% of all rioters were white juveniles, but they also form 8.0% of total UK population - no major overrepresentation is involved. Juveniles being black leads to much more striking results than overall special education or free meals.
Fig. 5. Sources: MoJ report (Table 1.16), BBC report
Ethnicity more important than unemployment: London riots
Lower employment, wealth, education all correlate with the riots. But they also correlate with ethnicity. No major social group (unemployed, poor, undereducated) has such a small population as black Britons, yet is so unusually prominent in the riots. The social groups are spread across the UK, but the riots are concentrated in black areas. As shown in the previous article, many poor and unemployed areas had no riots: Northeast England, major cities in Wales, North Ireland, Scotland. In London, all major riots were predominantly black. Lambeth is particularly dramatic, with blacks constituting 82% of the arrested and whites only 10%.

Fig. 6. Sources: MoJ report (Table 1.7)
My previous article provides a set of London riots mapped with various factors. Now that the approximate number of crimes per borough is known, it is possible to map the concentration of riots. Note that the map is best viewed with the table below, since areas like Bexley (East London) are not especially black. In some cases, the black population was low, but could compensate for this by extreme overrepresentation, such as in Wandsworth (7.8% total people are black, 5.2 crimes per 10 000, but 61% rioters were black). Names of boroughs can be found here.
Fig. 7. Sources: Home Office report , ONS key regional statistics
Unemployment is still usually cited as the main correlate of the riots. Indeed, black people in all London boroughs are much more likely to be unemployed than whites. But their overrepresentation among rioters is even greater than their overrepresentation among the unemployed. That means unemployment and poverty do not entirely explain black rioting. Lambeth and Wandsworth did experience particularly intense rioting, but otherwise there is no correlation between inequality in unemployment and riots.
Fig. 8. Sources: MoJ report (Table 1.7), JSA claimants by ethnicity
Albeit black Londoners have an increased chance of being unemployed, it is not as large as to make them the majority of all unemployed. Yet the increased chance to riot does turn them into the rioting majority. While the graph above deals with likelihood, the graph below shows total percentage of unemployed and rioters by ethnicity.
Fig. 9. Sources: ONS ethnicity estimates, JSA claimants by ethnicity
MoJ table 4.5 shows that the unemployed are unusually frequent among white rioters, but not among black rioters. In fact, the proportion of JSA claimants among black rioters (~20%) is smaller than among white rioters (~25%). Still, even unemployed whites are underrepresented in the riots in comparison to average blacks.
London boroughs and potential riot factors
There is a variety of factors that have correlation with the riots, including ethnicity, education, poverty, and others. Below is a table summarising some of the key facts about the riots. Brent seems to be an exception from all correlates, since the police were deployed there preventively. There was also little or no rioting in central areas like Westminster, Hammersmith and Fulham, and Kensington and Chelsea. No ethnic data on Ealing and Tower Hamlets riots are available. [CSV version]
Fig. 10. Sources: see below
Conclusion
Socioeconomic factors prove meaningless to the riots when they are not a correlate of ethnicity. Using police CCTV sources proved to be a viable method of measuring the ethnic makeup of rioters. Consequently, the conclusions of the previous article remain unaltered. Even if 'chavs' formed a part of the rioters, they were a clear minority. The media should focus on ethnicity when discussing the riots, rather than obfuscating this factor by citing Salford, which is the only instance of black Britons not being overrepresented. Black Britons are dramatically more likely to take part in the riots than their compatriots of other ethnicities, including whites of any social status.
Sources
Riots data
Ministry of Justice data from 'Statistical bulletin on the public disorder of 6th-9th August 2011': http://www.justice.gov.uk/downloads/publications/statistics-and-data/mojstats/disturbances-stats-bulletin-tables-241011.xls
Home Office 'An overview of recorded crimes and arrests resulting from disorder events in August 2011': http://www.homeoffice.gov.uk/publications/science-research-statistics/research-statistics/crime-research/overview-disorder-aug2011/overview-disorder-aug2011?view=Binary
BBC 'England rioters 'poorer, younger, less educated'': http://www.bbc.co.uk/news/uk-15426720
General data
ONS 'Region and Country Profiles - Key Statistics Tables - October 2011': http://www.ons.gov.uk/ons/publications/re-reference-tables.html?edition=tcm%3A77-227724
ONS 'Population Estimates by Ethnic Group Mid-2009 (experimental) - Current Estimates': http://www.ons.gov.uk/ons/publications/re-reference-tables.html?edition=tcm%3A77-50029
Jobseeker's allowance claimants by ethnicity: http://data.gov.uk/dataset/jobseekers_allowance_jsa_claimants_by_ethnicity
Labour market statistics for February 2011: http://www.ons.gov.uk/ons/rel/subnational-labour/regional-labour-market-statistics/february-2011/rft-lm-reg-monthly-table.zip
London ethnic groups by borough, 2005: http://legacy.london.gov.uk/gla/publications/factsandfigures/dmag-update-20-2007-ons-ethnic-group-estimates.pdf
Maps of ethnicity, education, class and other factors in London: http://www.londonprofiler.org/
the riots started as a reaction to a black man being killed by police, so its realistic that a large number of rioters would be black
ReplyDeleteThis comment has been removed by the author.
DeleteAlso, given that a lot of the post-riot arrests were based on CCTV footage, those already known to the police were more likely to get lifted after the event. Seen in the context of years of stop and search which predominately targets black youths, as well as other intelligence collection on BME communities, its not unreasonable to suggest that these groups would be over-represented in the post-event arrests.
ReplyDeleteChunky - are you saying a tribal affiliation counts for more than a general sense of justice? What white riots are you familiar with when white people get shot? If there are none (those limited riots there have been made up of whites seem to start more as over social justice /wealth)which we both know there are, does this mean that black people are more likely to riot?
ReplyDeleteRoy, Humstats has already explained that his first study, partly based on CCTV footage released by police forces correlated fairly well with the later stats produced by the government.
ReplyDeleteOn a separate note why is it that according to MOJ govstats that the average rioter had 11 previous offences for things like burglary, violence and so forth and were were 22 times more likely than the general population to have a record? If blacks were dramatically overrepresented here and are a minority of the UK population is it really all to do with some sort of 'institutional racism'?